Dwarf nova ASAS 023322-1047.0 (Cet) was discovered
on 2006, Jan 20.121 UT at mag V= 12.08, using the
ASAS3V instrument, by B. Pilecki, Warsaw University
Astronomical Observatory. The object is located at
RA: 02h33m21.4s and Decl.: -10°47'04.6"
(J2000), hence quite unfavourable as seen from
Belgium (50° North).
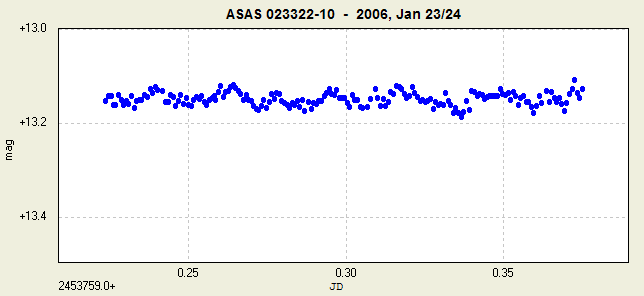
CBA Belgium observations dd 2006, Jan 23/24
I started a time-series (unfiltered) CCD
photometry session of this target on Jan 23.72 UT,
using a 0.35-m f/6.3 telescope and ST-7XME camera at
CBA Belgium Observatory. The session lasted for 3.6
hours, and shows the presence of a weak
periodic signal, that might indicate the
emergence of early superhumps, although still
unsure at this moment. The linear trend of decline
has been removed from the light curve below.

A period analysis using Peranso's
ANOVA method, yields a period of 0.055 +/- 0.005 d,
with an amplitude of about 0.1 mag. If this signal
relates to early superhumps, it would be amongst the
shortest presently known. The object faded by
approx. 0.04 mag over the course of my session. A
period significance analysis, using a Fisher
Randomization Test (with 200 Monte Carlo
permutations), yields a false alarm probability
close to 0%, hence indicating that the above signal
is quite likely secure.
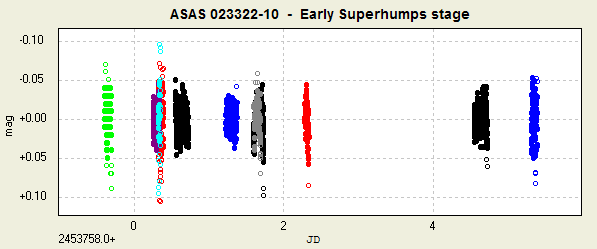
CBA and AAVSO observations of the Early
Superhump Stage
Following the above announcement, I received
additional CCD observations of ASAS 023322-1047.0
from Tom Krajci, David Boyd, Berto Monard, Michael
Armstrong, Tim Crawford and Diego Rodriguez Perez. Our dataset now comprises a total of
2222 observations, covering a time span of 5.8 days,
i.e. the entire initial outburst stage.
