Light curve windows
|
Upon initiating the photometric reduction through the Photometry dialog box, you can utilize the Show Light Curves command to display (unfolding) Light curve windows for Target variable stars identified during the photometry process. This section provides insights into effectively utilizing the Light curve windows. A Phoranso Light Curve window (abbreviated as LCWin) serves the purpose of visualizing and managing time-series data (light curves), derived from the photometric reduction process. In the LCWin, the abscissa (X axis) represents the time span of the plotted observations, typically displayed in Julian Date (JD). The ordinate (Y axis) represents the brightness of the observations, indicated in terms of magnitude. Each observation within a Phoranso LCWin is characterized by the following attributes:
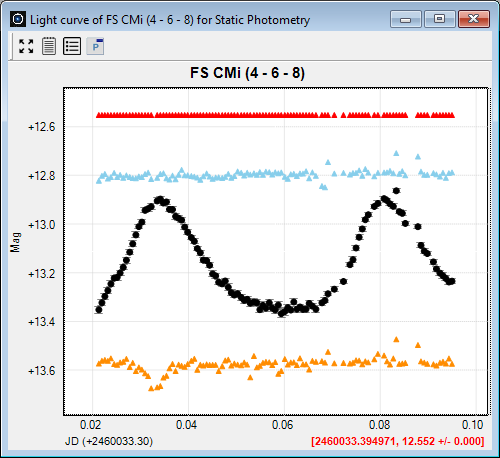
Here is an illustrative example of a Phoranso LCWin, depicting the light curve of the Target variable star FS CMi (a High Amplitude Delta Scuti star) in black. Additionally, the associated light curves of the Reference, Check and Comparison stars are displayed in red, light blue and orange, respectively.
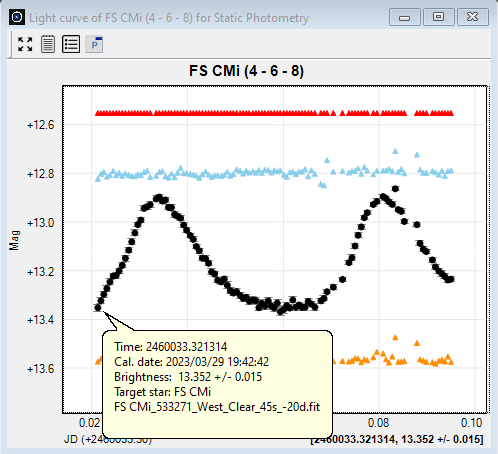
Reading the time of an observation The X axis of the LCWin is labeled JD (Julian Date), representing the time of the observations. The label (+2460033.30) situated just to the right of the JD label indicates the Baseline time value. All X axis values have to be read in relation to the Baseline value. Example : if an X axis label is 0.04, it corresponds to a time value of JD 2,460,033.30 + 0.04 = 2,460,033.34. The Y axis of the LCWin is labeled mag (magnitude), representing the brightness of the observations. Mouse coordinates The label [2460033.394971, 12.552] in the bottom right corner indicates the mouse coordinates (time, brightness). When hovering over an observation, the precise time and brightness of that observation are displayed in the corresponding star color, and the font becomes 'bold'. If the cursor is not over an observation, the time and brightness of the cursor position are shown in dark blue using a normal font. In the presence of a Brightness Error value for the observation beneath the cursor, this value is also displayed in the mouse coordinates. As the mouse hovers over an observation, a callout appears, revealing all relevant attributes of that specific observation. In addition to the Julian Date format for time, the Calendar Date is also presented. The user has the option to toggle the visibility of the observation callout box.
Zooming in and out on a light curve To zoom in on a light curve in a LCWin, follow these steps:
To zoom out again, double click the left mouse button. This action will redraw the window, zooming out on both the X and Y axes by a factor of 2. Modifying titles and labels Users have the flexibility to modify various graphical properties of a LCWin. This includex axes titles, the mouse coordinates label, the LCWin title, and more. Left click the mouse on the label you want to modify to change the text. Right click to adjust the font and color. The toolbar in the upper part of the LCWin groups frequently used commands, which will be discussed in the next section. |

