6. Visual inspection of light curves
|
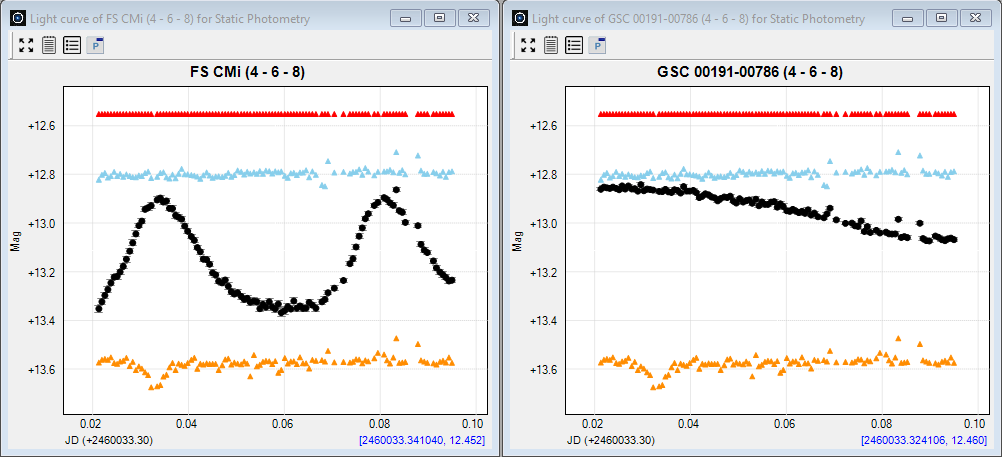
Watch your light curves unfold as the photometry is ongoing In step 3 of this tutorial, we selected 5 variable stars within the field of view of our FS CMi science images. We initiated the photometric reduction of our science images in step 5, and explained that this process may take approximately 5 to 15 minutes for completion, contingent upon the CPU speed of your PC. While this photometric reduction is ongoing, Phoranso provides a unique opportunity to preview the interim light curves of all variables present in our science images. This feature allows you to observe the unfolding light curves in real-time as the photometric reduction advances. Follow these steps: 1. Click the Show Light Curves button located at the bottom of the Photometry dialog box. This action opens the Select Target stars dialog box, presenting all variables for which photometric data are available. 2. From the list, choose one or more target stars and click the OK button. If the list is extensive, you can first sort all target stars alphabetically with the Sort button. Alternatively, opt for a selection of all target stars using the Select all button. 3. Upon pressing OK, Phoranso will display Light curve windows for each selected target star. If only one target star is present in your science images, step 2 will be bypassed and Phoranso will immediately display the corresponding Light curve window. 4. Suppose you select FS CMi and GSC 00191-00786 as target stars and press OK. Below is an illustration of how the Light curve windows might appear at some point during the photometric reduction process. 5. Each Light curve window shows the photometric data of the Target star, Reference, Check and Comparison stars, distinguished by distinct colors: black, red, light blue and orange, respectively. The title of the Light curve window includes the name of the Target star, followed by the selected Ringset in parentheses.
Light curve windows provide an array of options for tailoring the display of photometric data to your specific preferences and adjusting the visual appearance of numerous controls. We highly encourage you to read this section for a comprehensive explanation of working with light curve windows and configuring them to meet your needs. Visual inspection of light curves Upon the completion of the photometric reduction process for the FS CMi science images, the two Light curve windows, as described in step 5 above, will look like this:
You can now start a quick visual inspection of the light curves. You will notice a/o:
Proceed to step 7 of the tutorial. |

